
From Data to Decisions
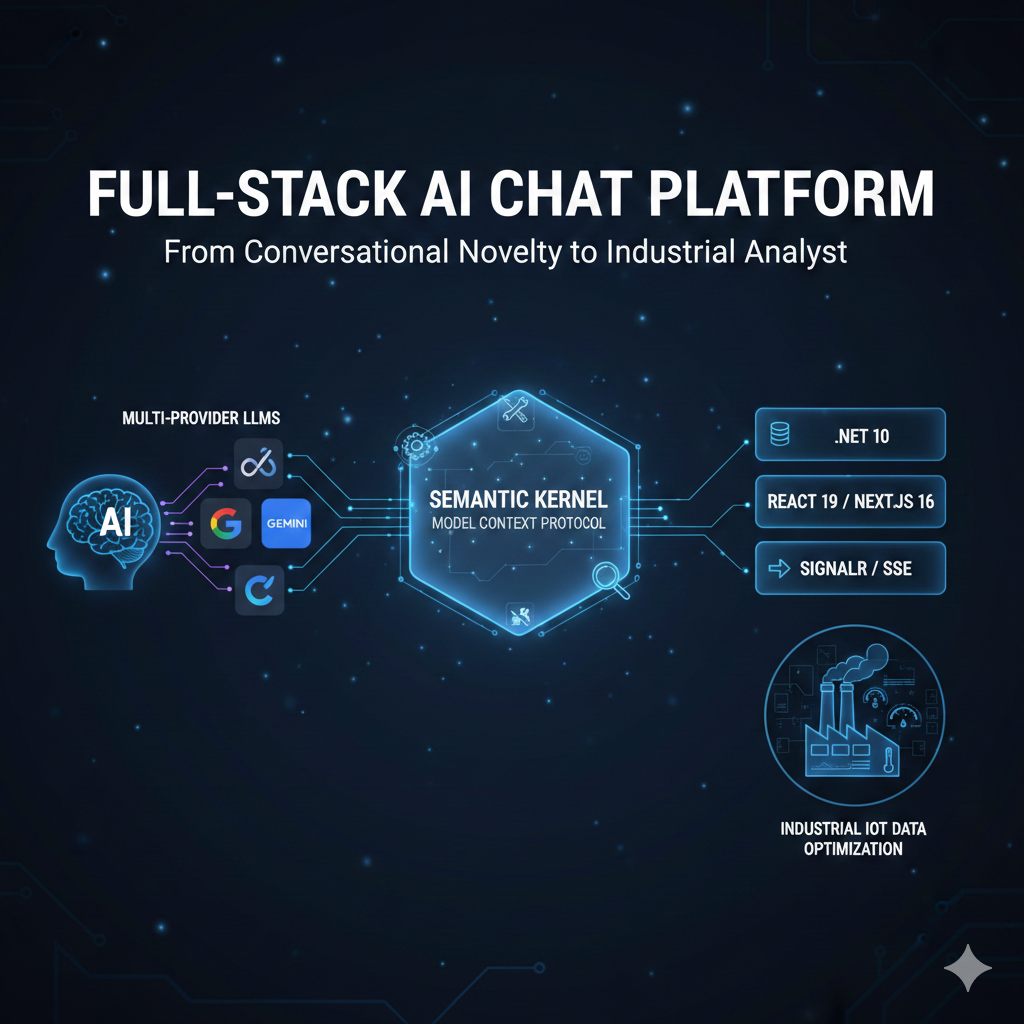
How AI Turns System Behavior into Actionable Insight
A New Role for AI in Real-World Systems
The Problem: We Measure Everything — and Understand Almost Nothing
It is January. Outside, −6 °C.
I am standing in the basement, staring at a number: `438 kg`.
Three more weeks? Or only ten days?
At home, I run a pellet heating system. As soon as the storage tank starts to empty, the daily estimation begins:
When do I need to reorder? And how expensive will it be this time?
During this phase, I observe the system more closely.
I can only see the current temperatures, operating states, numbers.
What I do not see is quality.
- Is the system operating efficiently?
- Or am I literally burning money?
- Is this behavior normal — or subtly problematic?
Modern heating systems generate data every second (temperatures, runtimes, cycling behavior, ignitions, flow rates).
From a technical standpoint, everything is there. What is missing is understanding.
And I think this is not a heating problem. Instead it is a systemic problem of modern technology:
We measure everything — and understand almost nothing.
Why Snapshots Are Misleading
A simple example:
Before:
User sees: flue gas temperature 168 °C
After:
Ø flue gas temperature: 112 °C
Only 3% of runtime >150 °C
Without historical data, both states appear identical. Only time series and context make efficiency visible.
That was the key realization for me:
I do not need another dashboard.
I need a system that interprets these data the way an experienced technician would.
And that is exactly where the role of AI begins.
The Solution: From Measurements to Decisions
The heating system already exposes its data via an API, including:
- Temperatures (supply, return, flue gas)
- Combustion parameters (residual oxygen)
- Operating states (ignition, emergency operation)
- Actuators (fans, pumps)
- Counters (ignitions, full-load hours)
- Energy measurements (power, energy, flow, temperature spread)
A deliberately curated excerpt illustrates the range:
- Boiler supply / return / flue gas
- Residual oxygen (combustion quality)
- Flue gas fan target/actual speed (control behavior)
- Boiler pump request/state
- Ignitions and full-load hours
- Power, energy, flow, temperature spread
Taken individually, these are just numbers.
Combined, they tell a story about:
- Efficiency
- Wear
- Malfunctions
The Core Idea
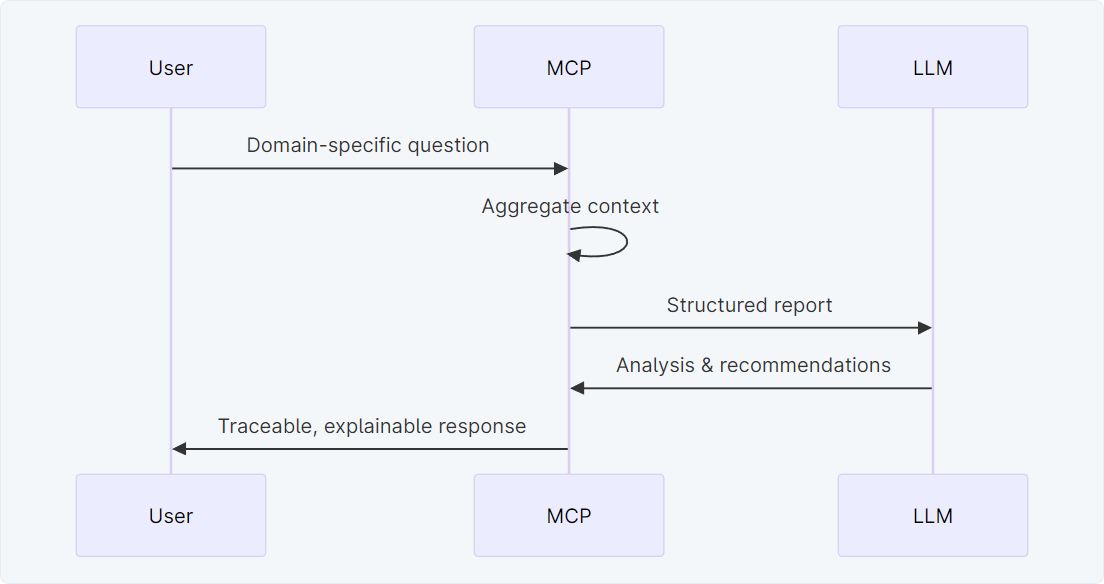
These data are not visualized, but interpreted. An MCP server prepares them in a structured way and provides them to an LLM. The model does not take control — it performs analysis.
Numbers become decisions.
For this to work, the data must be stored historically. The device itself only provides snapshots. So I store the relevant measurements myself — deliberately time-based, not state-based. Static configurations (schedules, etc.) are intentionally excluded. They rarely change and add little value for efficiency analysis.
The task of the LLM is clearly defined:
- Understand data, not just read it
- Detect patterns
- Classify deviations
- Derive actionable recommendations
Typical questions include:
- Is an unscheduled cleaning advisable?
- Does the cycling behavior indicate an incorrect heating curve?
- When is the optimal time to reorder pellets?
Architecture: Strict Separation of Responsibilities
The architectural principle is intentionally simple — and strictly separated:

The Four Roles
Data Collector
Polls the API and stores measurements
Time-Series Database
Persists historical data, no interpretation
MCP Server
Contextualizes, aggregates, explains
LLM
Analyzes — never accesses raw data directly
This separation is critical:
- The data collector knows nothing about AI
- The LLM knows nothing about the heating API
- Both are fully decoupled
Context Instead of Raw Data
The data collection service only stores:
“What happened, and when?”
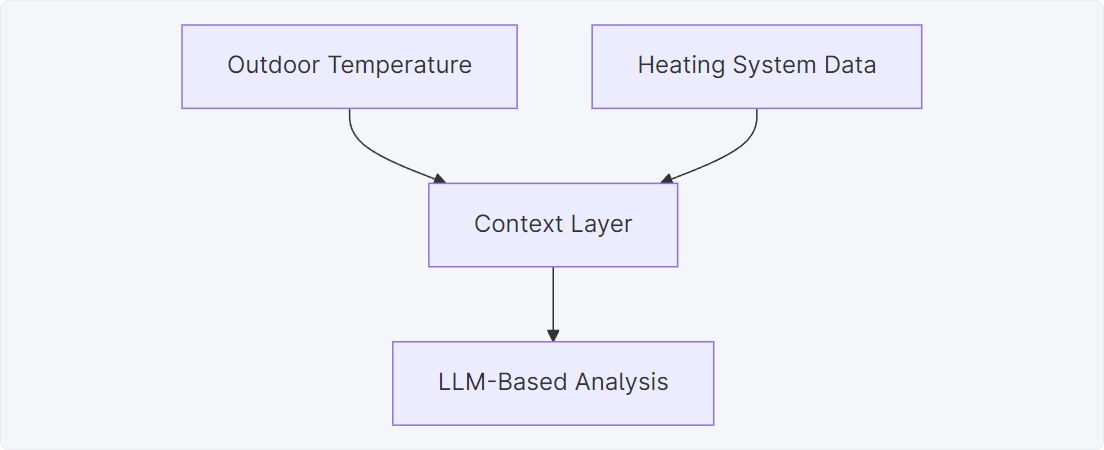
The MCP server answers:
“What does it mean?”
Its responsibilities include:
- Aggregation of time windows (24 h, 7 days, 30 days)
- Calculation of simple derivatives (Averages, Trends, Deviations, Enrichment with external context (weather))
Why weather data is essential:
A week at −8 °C produces a completely different operating profile than a week at +8 °C.
Efficiency cannot be evaluated in isolation.
The MCP server does not deliver tables to the model, but statements such as:
- “Average supply temperature over the last 14 days”
- “Ignitions per day compared to the previous month”
- “Deviation of flue gas temperature from the long-term average”
- “Consumption per heating degree day”
For the LLM, this does not feel like data analysis, it feels like reading a technical operating report.
Implementation: Deliberately Unspectacular
Data Collection
A lean `.NET` service:
- periodic API polling (e.g., every 60 seconds)
- extraction of relevant values
- normalization
- storage as snapshots
No logic.
No rules.
No interpretation.
The service runs as a Docker container: stable, portable, replaceable.
Persistence
Data is stored in PostgreSQL with TimescaleDB.
What matters is not the current state, but the evolution over time:
- temperature trends
- cycling frequency
- control stability
- consumption relative to weather
Trends beat snapshots.
MCP Server & LLM: Analysis, Not Oracle
The MCP server is the only interface to the model.
The LLM:
- makes no decisions
- controls nothing
- accesses no raw data
It analyzes only the provided context.
Example outcomes:
- “Cycling frequency has increased by 35% — indicating an overly steep heating curve.”
- “Flue gas temperature remains above reference — efficiency potential exists.”
- “Consumption per kWh is steadily rising — cleaning is recommended.”
AI does not replace a technician. It makes implicit knowledge explicit.
Transferability
The heating system itself is interchangeable.
The same pattern applies to:
- photovoltaic systems
- industrial machinery
- energy monitoring
- business performance metrics
Anywhere systems generate vast amounts of data, but little understanding.
Outlook
The future of AI is not in generating text.
It lies in translating system behavior into decisions.
- Those who collect data know a lot.
- Those who understand data act better.
- Those who create context gain control.